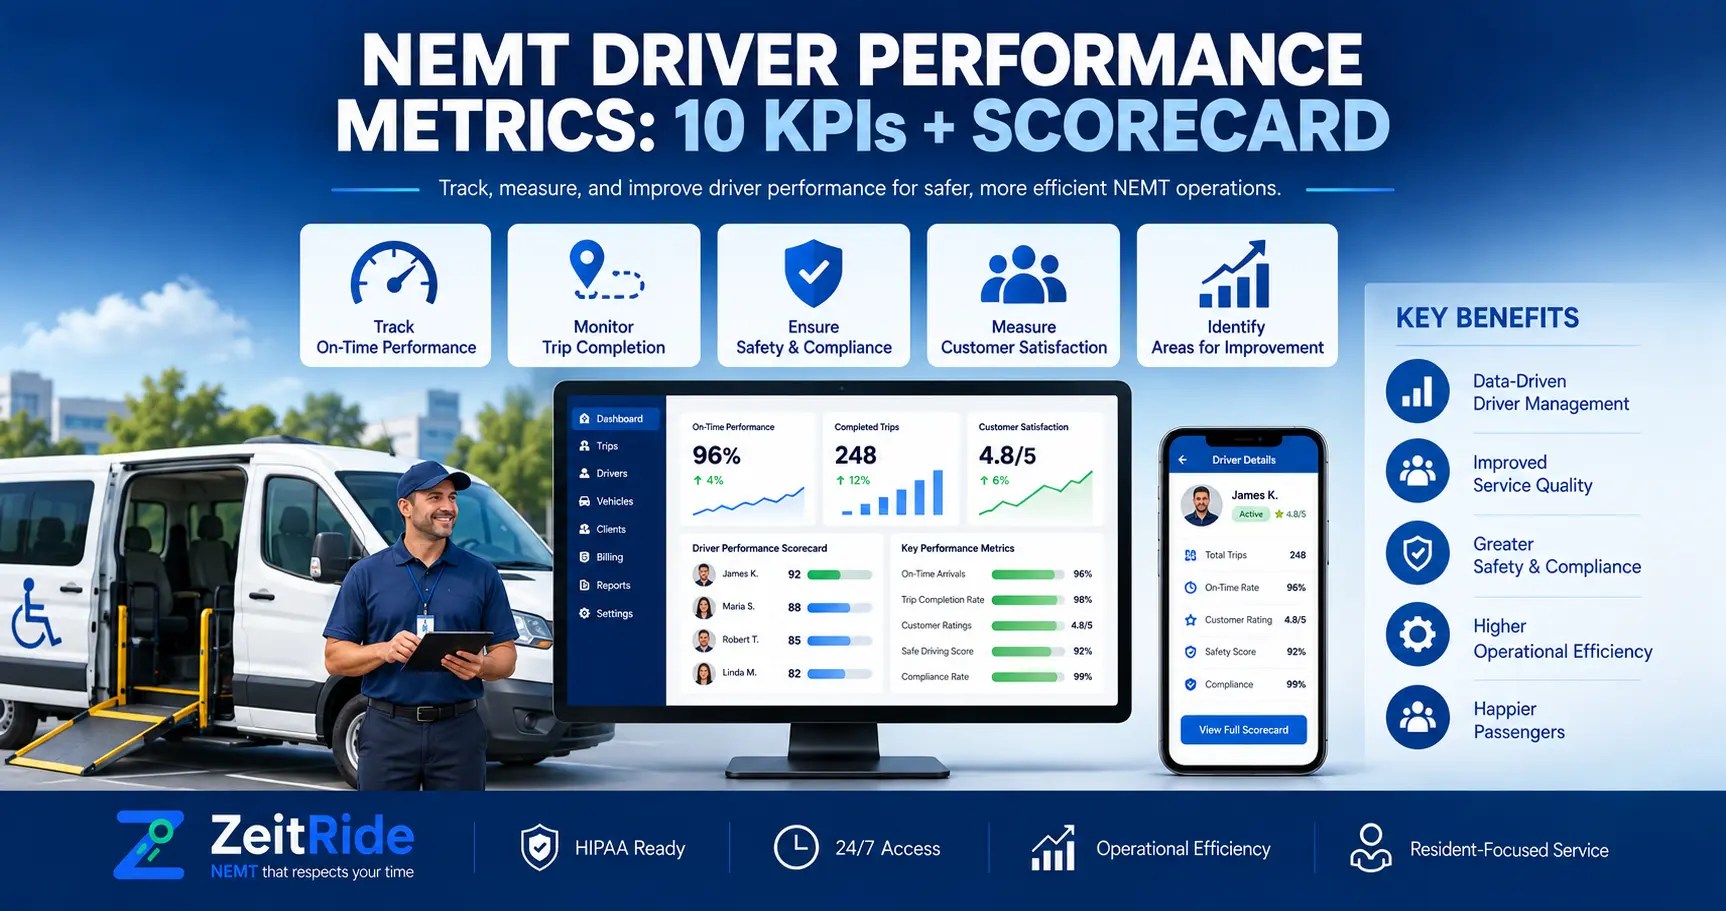
NEMT Driver Performance Metrics: 10 KPIs + Scorecard
Learn 10 NEMT driver performance metrics and build a practical scorecard for productivity, on-time service, safety, documentation, and compliance.
Quick answer
Measure NEMT driver performance with a balanced scorecard covering on-time pickups, trip completion, productivity, status updates, documentation, safety, and service exceptions while separating driver-caused issues from operational delays.
ZeitRide Team
NEMT Operations Expert
Running an NEMT fleet means managing more than completed trips. Operators also need to know whether drivers are arriving on time, following trip workflows, documenting service correctly, using paid hours efficiently, and delivering consistent service. That is where NEMT driver performance metrics help. A useful driver scorecard should not simply reward the driver who completes the most trips. Trip distance, mobility level, facility delays, route design, geography, and shift length can all affect performance. Instead, operators should evaluate several metrics together and determine which results were actually within the driver's control. For example, a late pickup may come from a late departure, but it could also result from an earlier facility delay, unrealistic scheduling, traffic, or a dispatch change. For a deeper explanation of punctuality measurement, see ZeitRide's guide to NEMT on-time performance.
How Do You Measure NEMT Driver Performance?
To measure NEMT driver performance fairly, track a combination of reliability, productivity, documentation, workflow compliance, safety, and service-quality metrics. The strongest NEMT driver scorecard answers three questions: What happened? Why did it happen? Was the result within the driver's control? This prevents managers from making decisions based only on raw trip counts or isolated late pickups.
10 NEMT Driver Performance Metrics to Track
| Metric | Basic Formula | What It Measures |
|---|---|---|
| Eligible trip completion rate | Completed eligible trips ÷ eligible assigned trips × 100 | Reliability |
| On-time pickup rate | Eligible on-time pickups ÷ eligible pickups × 100 | Timeliness |
| Status update compliance | Trips with required updates ÷ trips requiring updates × 100 | Workflow discipline |
| Documentation completeness | Properly documented trips ÷ trips requiring documentation × 100 | Documentation quality |
| Inspection completion rate | Completed required inspections ÷ required inspections × 100 | Operational compliance |
| Trips per paid hour | Completed eligible trips ÷ paid hours | Productivity |
| Active service ratio | Productive service time ÷ paid hours × 100 | Time utilization |
| Avoidable idle time | Avoidable idle time ÷ paid hours × 100 | Controllable downtime |
| Verified safety-event rate | Verified events ÷ defined exposure | Safety trend |
| Driver-attributable exception rate | Verified driver-related exceptions ÷ completed trips × 100 | Service quality |
1. Eligible Trip Completion Rate
Trip completion measures whether assigned transportation was successfully completed. However, the denominator matters. Rider cancellations, legitimate no-shows, dispatch reassignments, or vehicle problems should not automatically become driver failures. Use: Eligible Trip Completion Rate = Completed Eligible Trips ÷ Eligible Assigned Trips × 100. Define what counts as an eligible trip before comparing drivers.
2. On-Time Pickup Rate
On-time pickup rate shows how consistently drivers meet the pickup windows that apply to their trips. Use: On-Time Pickup Rate = Eligible On-Time Pickups ÷ Eligible Pickups × 100. The applicable definition of "on time" should come from the relevant broker, payer, contract, facility agreement, or company policy. Before attributing a late pickup to the driver, review the previous trip, route sequence, schedule, facility delay, and dispatch activity.
3. Status Update Compliance
Trip statuses help dispatchers understand what is happening in the field. Depending on the workflow, drivers may need to record events such as en route, arrived, picked up, dropped off, or completed. Use: Status Compliance = Trips With Required Status Updates ÷ Trips Requiring Updates × 100. The ZeitRide Driver App connects trip assignments, driver status updates, GPS-supported workflows, inspections, and signatures with dispatch, reducing the need to reconstruct field activity later.
4. Documentation Completeness
A completed ride is not always a complete trip record. Depending on operating requirements, supporting information may include timestamps, mileage, signatures, notes, exception reasons, or other trip documentation. Use: Documentation Completeness = Properly Documented Trips ÷ Trips Requiring Documentation × 100. Drivers should only be measured on information they are responsible for recording.
5. Inspection Completion Rate
If drivers are required to complete vehicle, wheelchair-lift, pre-trip, post-trip, or other assigned inspections, completion should be tracked separately. Use: Inspection Completion Rate = Completed Required Inspections ÷ Required Inspections × 100. Management should review the underlying inspection process as well as the completion rate. A checked box alone does not prove that an inspection was meaningful.
6. Trips Completed per Paid Hour
Raw trips per day can create misleading comparisons because drivers work different shifts and serve different trip types. A more useful NEMT driver productivity metric is: Trips per Paid Hour = Completed Eligible Trips ÷ Paid Driver Hours. Compare similar operating conditions whenever possible. A driver handling short urban ambulatory trips should not automatically be compared with a driver covering long-distance wheelchair transportation.
7. Active Service Ratio
Active service ratio measures how much paid time is associated with productive transportation activity. A fleet might calculate: Active Service Ratio = Defined Productive Service Time ÷ Paid Hours × 100. The key is defining productive time consistently. It may include passenger transportation, travel to an assigned pickup, loading, securement, and other legitimate trip-related activity.
8. Avoidable Idle Time
Idle time can reveal operational inefficiency, but not every idle period is the driver's responsibility. A driver may be waiting because a medical facility is running late, a rider is not ready, dispatch created a schedule gap, the next trip begins later, or no eligible trip is available nearby. Track the reason for downtime before using idle time as a driver-performance measure.
9. Verified Safety-Event Rate
Safety performance should be based on verified information rather than assumptions. If your organization tracks incidents or relevant telematics events, normalize them using a consistent exposure measure such as miles, operating hours, or completed trips. The important point is consistency. Use the same methodology across drivers and review the actual event before making performance decisions.
10. Driver-Attributable Service Exceptions
Complaints and service exceptions can reveal patterns, but raw totals can be misleading. First determine whether an issue was substantiated and whether the driver was reasonably responsible. Then calculate: Driver-Attributable Exception Rate = Verified Driver-Related Exceptions ÷ Completed Trips × 100. Normalizing the result prevents high-volume drivers from automatically appearing worse simply because they serve more passengers.
NEMT Driver Scorecard Template
A practical NEMT driver scorecard template should show more than a final number. It should help managers understand the metric, identify the cause, and decide what happens next.
| Scorecard Field | What to Record |
|---|---|
| Driver | Driver name or ID |
| Review period | Week or month |
| Metric | Metric being measured |
| Current result | Current performance |
| Previous result | Previous comparable period |
| Target | Applicable company, contract, or operational target |
| Data source | Trip record, GPS, driver app, inspection, or other verified source |
| Root cause | Driver, dispatch, scheduling, facility, vehicle, rider, external, or mixed |
| Action | Recognize, coach, train, investigate, adjust, or monitor |
| Follow-up | Next review date |
Separate Driver Performance From Operational Problems
One of the biggest mistakes in NEMT driver performance management is assuming every poor result is caused by the driver. Consider the operating context first.
| Result | Possible Driver Cause | Possible Operational Cause |
|---|---|---|
| Late pickup | Late departure | Schedule, traffic, or facility delay |
| Low trips per hour | Avoidable downtime | Long distances, service level, or low demand |
| High idle time | Unapproved stop | Schedule gap or facility wait |
| Missing status | Driver missed update | App, network, or workflow issue |
| Route deviation | Unnecessary detour | Road closure or dispatch instruction |
| Low completion | Driver-related issue | Cancellation, no-show, reassignment, or vehicle problem |
This is also why individual driver metrics should be reviewed alongside broader NEMT fleet reports. Fleet-level reporting helps managers see whether a performance problem belongs to one driver or reflects a larger scheduling, routing, utilization, or operational issue.
How to Measure NEMT Driver Performance Fairly
If you are deciding how to measure NEMT driver performance, use a consistent process instead of changing the rules from one driver or review period to another.
- Define each metric before measuring it.
- Use the same formula across comparable drivers.
- Identify which trips belong in each calculation.
- Separate driver-controlled events from operational causes.
- Compare similar service types and workloads whenever possible.
- Use contract, payer, broker, regulatory, or company requirements where applicable.
- Review the actual trips behind unusual results.
- Track trends instead of overreacting to one bad day.
- Use performance data to identify coaching or operational improvements.
The purpose of measurement should be improvement, not simply scoring. Fair and transparent performance management can also support workforce stability. ZeitRide's NEMT driver retention guide covers additional operational factors that affect driver experience and retention.
How NEMT Software Supports Driver Performance Management
Creating driver scorecards manually becomes difficult when scheduling, GPS, driver hours, inspections, trip statuses, documentation, and payroll live in separate systems. Before a manager can investigate performance, someone must first combine the data. A connected NEMT platform simplifies that workflow: Schedule → Driver Assignment → Trip Activity → Status and GPS Data → Documentation → Reporting. That gives managers better context behind a metric instead of only seeing a percentage. It also creates a clearer connection between NEMT driver productivity, dispatch decisions, scheduling, workload, and completed service.
Avoid Universal NEMT Driver Benchmarks
There is no single performance target that works for every NEMT fleet. Trip mix, service area, contract requirements, mobility levels, vehicle types, operating policies, and geography can all change what useful performance looks like. Where an authoritative requirement exists, use it. Where one does not exist, establish a documented internal baseline, apply the calculation consistently, and measure improvement over time. Avoid copying a percentage from another fleet and treating it as an industry standard without understanding how that organization calculated it.
Build the Scorecard From the Same Data That Runs Your Fleet
The strongest driver scorecard should help managers understand operations, not create another spreadsheet that needs to be rebuilt every week. When scheduling, dispatch, driver activity, GPS-supported trip events, documentation, inspections, payroll, and reporting connect in one workflow, managers can move from a score to the actual trips behind it. That makes NEMT driver performance metrics more useful for coaching, planning, compliance review, workload management, and daily decision-making. ZeitRide NEMT software connects scheduling, dispatch, routing, driver workflows, billing, reporting, and operational trip records in one platform.
Frequently Asked Questions
Q: What are the most important NEMT driver performance metrics?
Important NEMT driver performance metrics include eligible trip completion, on-time pickups, status update compliance, documentation, inspections, productivity, avoidable idle time, verified safety events, and substantiated service exceptions.
Q: What is an NEMT driver scorecard?
An NEMT driver scorecard is a structured framework used to evaluate a driver's reliability, productivity, workflow compliance, safety, documentation, and service quality using consistent operational data.
Q: How do you measure NEMT driver productivity?
NEMT driver productivity can be measured using metrics such as completed eligible trips per paid hour and active service ratio. Results should account for trip distance, service type, geography, facility delays, and assigned workload.
Q: Should no-shows count against an NEMT driver?
Not automatically. A rider no-show should normally be separated from driver performance unless the driver failed to follow required arrival, waiting, communication, or documentation procedures.
Q: Should late pickups always count against the driver?
No. Late pickups can result from driver behavior, but they may also be caused by scheduling, route design, facility delays, traffic, vehicle issues, rider delays, or dispatch changes.
Q: How often should NEMT driver performance be reviewed?
Operational exceptions should be reviewed promptly. Weekly reviews can identify short-term patterns, while monthly reviews are useful for productivity trends, coaching progress, and recurring performance issues.
See Driver Performance Without Another Spreadsheet
ZeitRide connects dispatch, driver activity, trip statuses, GPS-supported workflows, inspections, documentation, payroll, and reporting so managers can review performance using the same operational data that runs the fleet. See how ZeitRide works with your fleet and bring your actual driver and dispatch workflow to the conversation.
Rather see it than read about it?
Bring a real route, a couple of drivers, and your current process. 15 minutes, zero pitch.