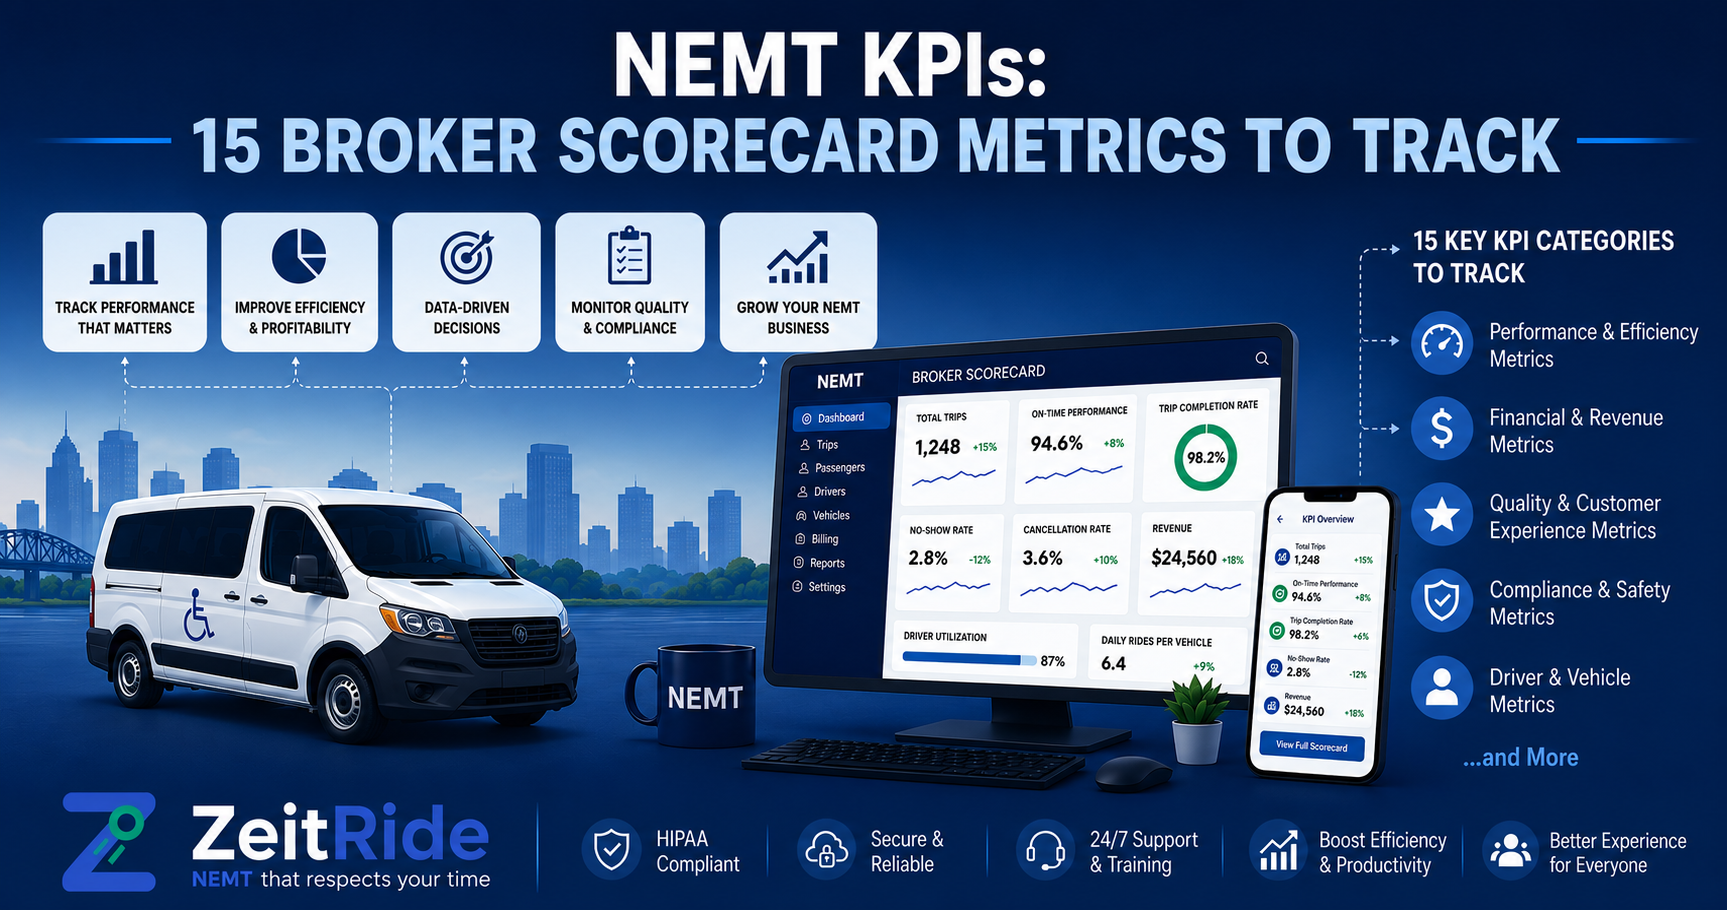
NEMT KPIs: 15 Broker Scorecard Metrics to Track
Learn the NEMT KPIs brokers use to assess providers, including formulas, benchmark guidance, and practical ways to improve fleet performance.
Quick answer
NEMT providers should track on-time performance, trip fulfillment, cancellations, no-show evidence, vehicle utilization, deadhead mileage, claim quality, and trip-record completeness. Use broker contract requirements as the main benchmark and review results by route, driver, vehicle, and broker.
ZeitRide Team
NEMT Operations Expert
NEMT providers often know how many trips they completed, but trip volume alone does not show whether the operation is reliable or profitable. A provider may complete hundreds of trips while experiencing late pickups, excessive empty mileage, vehicle downtime, incomplete documentation, denied claims, or avoidable cancellations.
Tracking the right NEMT KPIs helps operators identify these problems before they affect broker relationships, passenger service, and fleet margins. A connected NEMT reporting system also reduces the need to manually combine information from spreadsheets, driver messages, GPS tools, and broker portals.
Which NEMT KPIs Should Providers Track?
NEMT providers should track performance across service reliability, broker performance, fleet efficiency, billing, profitability, compliance, and documentation. The most useful NEMT broker scorecard combines high-level results with the underlying trip data needed to investigate poor performance.
There is no single national benchmark that applies to every provider. Pickup windows, cancellation rules, documentation requirements, and service-level targets differ between brokers and contracts. Your contract should therefore be the primary benchmark, supported by your own 90-day operating baseline.
15 Essential NEMT Performance Metrics
| NEMT KPI | Formula or Measurement | Why It Matters |
|---|---|---|
| On-time pickup rate | On-time pickups / scheduled pickups x 100 | Measures pickup reliability |
| On-time drop-off rate | On-time arrivals / appointment trips x 100 | Shows whether passengers reach appointments on time |
| Trip fulfillment rate | Completed accepted trips / accepted trips x 100 | Measures the ability to complete assigned work |
| Provider cancellation rate | Provider-caused cancellations / accepted trips x 100 | Identifies preventable service failures |
| No-show evidence completeness | Documented no-shows / recorded no-shows x 100 | Protects the provider during broker disputes |
| Assignment response time | Time from trip offer to acceptance or assignment | Measures dispatch responsiveness |
| Complaint rate | Substantiated complaints / completed trips x 1,000 | Tracks rider experience and service quality |
| Vehicle utilization rate | Productive vehicle hours / available hours x 100 | Shows how effectively fleet capacity is used |
| Deadhead mileage percentage | Empty miles / total miles x 100 | Identifies non-revenue vehicle movement |
| Trips per vehicle per day | Completed trips / active vehicles | Measures daily vehicle productivity |
| Driver idle-time rate | Unassigned paid hours / available paid hours x 100 | Highlights scheduling and demand gaps |
| Revenue per vehicle per day | Trip revenue / active vehicles / operating days | Compares vehicle earning performance |
| Contribution margin per trip | Trip revenue minus direct trip costs | Shows whether trips contribute to profit |
| First-pass clean claim rate | Accepted claims / submitted claims x 100 | Measures billing accuracy |
| Complete trip-record rate | Complete records / completed trips x 100 | Tracks documentation and compliance quality |
How to Measure NEMT On-Time Performance
NEMT on-time performance should be measured using the exact pickup or appointment window stated in the applicable broker contract. The basic formula is: on-time pickup rate = on-time pickups divided by total scheduled pickups, multiplied by 100.
Store the scheduled time, permitted arrival window, actual arrival time, pickup time, and delay reason for each trip. Do not use one fleetwide definition if different brokers apply different rules.
When performance declines, review the affected trips by route, driver, vehicle, service area, and time of day. Common causes include late driver starts, unrealistic travel times, inefficient trip sequencing, delayed assignments, and unexpected waiting time. A live NEMT dispatch platform helps dispatchers identify developing delays and take action before a trip becomes late.
How to Measure Fleet Efficiency
Three of the most important fleet metrics are vehicle utilization, deadhead mileage, and trips per active vehicle. Vehicle utilization shows how much available fleet capacity is being used productively.
Providers should clearly define whether productive time includes passenger travel, approved waiting time, vehicle repositioning, or only revenue-generating activity. Without a consistent definition, the result cannot be compared accurately from one period to another.
Deadhead mileage measures how far vehicles travel without passengers. The formula is: deadhead percentage = empty miles divided by total miles, multiplied by 100. The objective is not to eliminate every empty mile because rural routes, return trips, and specialized vehicle requirements can make some empty travel unavoidable.
Use fleet utilization analytics to compare vehicles, drivers, shifts, and service areas. ZeitRide's guide to reducing dead miles through route optimization provides additional strategies for improving route efficiency.
How to Track Broker and Documentation Performance
A strong NEMT broker scorecard should separate provider-caused problems from events outside the provider's control. Do not combine provider cancellations, member cancellations, facility cancellations, duplicate trips, invalid addresses, and passenger no-shows under one general cancellation label.
No-show records should contain the evidence required by the applicable broker. This may include GPS arrival location, arrival and departure timestamps, call attempts, dispatcher notes, driver notes, required waiting time, facility confirmation, and approved reason codes.
Consistent no-show and cancellation records make it easier to resolve disputes and distinguish a documented passenger no-show from a provider service failure.
How to Measure Financial and Billing Performance
Operational volume is valuable only when completed trips produce collectible revenue. Revenue per vehicle per day helps compare earning performance across vehicles and routes, while contribution margin per trip subtracts direct costs such as driver labor, fuel, tolls, and parking.
Providers should also monitor their first-pass clean claim rate. The formula is: claims accepted without correction divided by total submitted claims, multiplied by 100.
Review failed claims by reason. Common issues include missing timestamps, incorrect mileage, wrong service codes, incomplete signatures, authorization problems, and mismatched trip statuses. Connected NEMT billing software helps providers use trip data captured during operations instead of reconstructing billing records later.
How to Set Reliable NEMT Benchmarks
Begin with the performance requirements in each broker, payer, facility, or managed care contract. Document both the target and the calculation method. For example, an on-time target is incomplete unless the scorecard also states the permitted pickup window, excluded trip types, and how canceled or no-show trips affect the calculation.
Next, establish a 90-day internal baseline and segment the results by broker, driver, vehicle, route, service area, day, shift, service type, and trip type. This prevents misleading comparisons between operations with different demand patterns.
- Green: The KPI meets the applicable contract requirement and internal target.
- Yellow: Performance is declining or approaching the permitted limit.
- Red: The KPI misses a requirement or shows a repeated negative trend.
- No status: The sample is too small or the available data is incomplete.
What an NEMT KPI Dashboard Should Include
An effective NEMT KPI dashboard should provide an executive summary without hiding the trip-level information needed to fix a problem.
- Current result and target for each KPI
- Weekly, monthly, and 90-day trend changes
- Filters for broker, driver, vehicle, route, and service area
- A list of trips responsible for missed targets
- Supporting timestamps, GPS data, and documentation
- Exception reasons and data-completeness warnings
- Assigned corrective action, owner, and review date
Review urgent trip exceptions daily, operational trends weekly, and broker, financial, billing, and compliance results monthly. Every red or repeatedly yellow KPI should have an owner, a corrective action, and a follow-up date.
Improve Performance With Connected NEMT Data
Software does not improve a KPI simply by displaying it. Improvement happens when the metric is connected to the workflow causing the result. A late-pickup report should lead to the affected trip and route. A deadhead report should reveal inefficient assignments. A claim-quality report should show which required field is missing.
ZeitRide's NEMT software connects scheduling, dispatch, routing, broker trip data, driver activity, billing, and reporting in one system. This allows operators to move from a scorecard result to the driver, vehicle, route, trip, or documentation issue behind it.
For additional guidance, read how providers can improve their NEMT broker trip volume by strengthening service reliability, documentation, and broker performance.
Start with the five NEMT KPIs most closely connected to your broker requirements and financial risks. Confirm each formula, establish a 90-day baseline, and investigate exceptions every week.
Ready to turn your NEMT KPI dashboard into better fleet decisions? Book a 15-minute ZeitRide demo and bring a real route, broker report, or operating workflow.
Frequently Asked Questions
Q: What are the most important NEMT KPIs?
The most important NEMT KPIs include on-time performance, trip fulfillment, provider cancellations, no-show documentation, vehicle utilization, deadhead mileage, complaint rate, clean claim rate, and complete trip-record rate.
Q: What is an NEMT broker scorecard?
An NEMT broker scorecard evaluates a transportation provider's reliability, cancellations, documentation, complaints, compliance, and other contract requirements. The exact metrics and targets differ between brokers.
Q: How is NEMT on-time performance calculated?
Divide the number of pickups completed within the broker-defined time window by the total number of scheduled pickups, then multiply by 100. Use the contract's exact definition when determining which trips count as on time.
Q: What is a good NEMT on-time performance rate?
A good on-time rate is one that meets or exceeds the applicable broker or payer contract. There is no universal national target because pickup windows, service areas, exclusions, and calculation rules differ.
Q: How often should NEMT providers review KPIs?
Providers should review urgent trip exceptions daily, operational trends weekly, and financial, billing, broker, and compliance scorecards monthly.
Q: Can NEMT software calculate KPIs automatically?
Yes. NEMT software can calculate KPIs when scheduling, dispatch, GPS, driver activity, broker data, billing, and trip documentation are connected. Providers should still confirm that each formula matches the applicable contract.
Rather see it than read about it?
Bring a real route, a couple of drivers, and your current process. 15 minutes, zero pitch.